By Furkaan Khan | AGR Knowledge Services
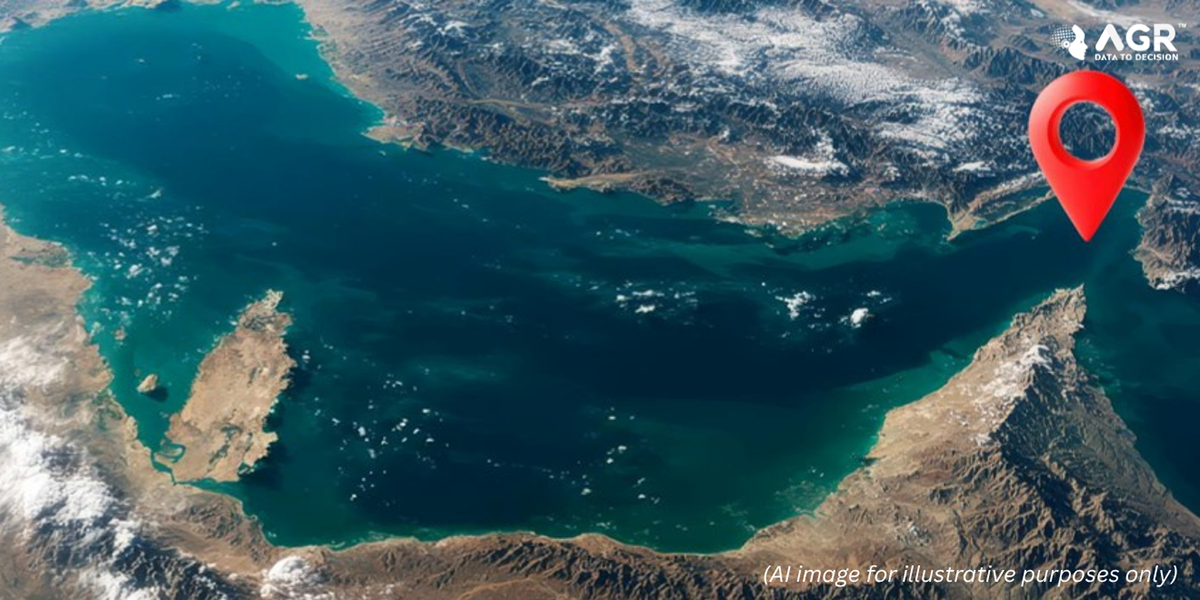
The Strait of Hormuz is usually discussed in terms of the roughly 20 million barrels of oil a day that passed through it in 2025. But the waterway also carries aluminium, fertilisers, sulphur and liquefied natural gas (LNG), and the shipping disruption that followed the outbreak of conflict on 28 February 2026 has exposed vulnerabilities well beyond energy markets. As of The International Food Policy Research Institute (IFPRI’s) mid-September assessment, fertiliser shipments out of the Gulf remained largely halted, while at least 28 attacks or security incidents involving shipping had been recorded in the Strait and surrounding waterways during the first half of October. Traffic has not stopped entirely, however: Lloyd’s List Intelligence counted at least 104 transits by non-Iranian-linked vessels between 5 and 11 October, 31% above the August weekly average but 17% below the previous week.
Exhibit 1 sets out how large the exposure is. Figures differ between sources because definitions differ (production versus exports, Gulf origin versus Hormuz transit, seaborne versus all trade), so ranges are shown where independent estimates diverge.
Exhibit 1. Gulf and Hormuz exposure by commodity
| Commodity | Gulf / Hormuz exposure | Basis (independent estimates) |
| Sulphur | Roughly 45–50% of global seaborne trade | International Energy Agency (IEA): Around half of seaborne trade. Argus: Gulf exports of about 20 Mt a year, or 50% of seaborne trade. Kpler: Up to 50%. Shanghai Metals Market (SMM): About 45%. International Fertilizer Association (IFA): Countries upstream of the Strait account for 49% of global sulphur trade. |
| Urea | Roughly 30–35% of traded volumes | IEA: Over 30% of global urea trade. Argus: Gulf exports of about 18 Mt a year, 32% of seaborne trade. Kpler: 30–40% of seaborne trade. Reuters: About a third. IFA: Countries upstream of the Strait account for 34% of global urea trade. |
| LNG | About 20% of global LNG trade | IEA: Just over 112 bcm transited in 2025, almost 20% of global trade. Except for deliveries to Kuwait, almost all Qatar and UAE. LNG exports transit the Strait. |
| Aluminium | About 8% of global primary output; a much larger share of some import markets | IEA and International Aluminium Institute (IAI): Around 8% of global production. The Gulf supplies about 28% of Japan’s, 21% of the US’s and 19% of the EU’s primary aluminium imports (IAI). |
Note: Estimates are indicative and use different denominators. Sulphur and urea figures combine Gulf-origin exports and seaborne or traded volumes; they should not be read as identical measures of physical Hormuz transit. Aluminium is a share of global primary production. Estimates for urea vary with country coverage: the Fertilizer Institute, for example, cites nearly 50% of global urea exports originating west of the Strait.
Aluminium: Concentrated supply, concentrated customers
Gulf smelters produce about 8% of the world’s primary aluminium, but they supply a far larger share of some import markets: roughly 28% of Japan’s primary aluminium imports, 21% of the United States’ and 19% of the EU’s. That makes lost output hard to replace quickly.
In April, Wood Mackenzie estimated that 6.8 million tonnes (Mt) of Middle Eastern aluminium production, equal to around 18% of global exports outside China, was exposed to the disruption, and that 3–3.5 Mt of 2026 output could be lost. The losses stem from more than shipping delays. Emirates Global Aluminium’s (EGA) Al Taweelah smelter in the UAE and Alba in Bahrain were both confirmed by their operators to have been struck on 28 March, and smelters have also faced shortages of imported raw materials such as alumina.
The IAI’s preliminary data show Gulf output fell to 10,989 tonnes a day in April, down 26.7% from March and about 38% below the pre-conflict baseline of around 17,800 tonnes a day. GCC production was 299,000 tonnes in August, equivalent to around 9,600 tonnes a day and nearly 43% below a year earlier. Global primary output was 2.1% lower than a year earlier in April. Aluminium is widely used in automotive, construction and packaging, leaving these downstream sectors exposed to a prolonged shortage. Recovery remains gradual: EGA reported on 21 October that half of the reduction cells at Al Taweelah had been restarted, with full production still targeted for the first quarter of 2027.
Sulphur: The less visible fertiliser bottleneck
Sulphur is recovered as a by-product of sour-gas processing and oil refining, so supply follows the geography of hydrocarbon processing, and the Gulf accounts for roughly 45–50% of seaborne trade (Exhibit 1). It is converted into sulphuric acid, which is essential for phosphate fertilisers and is also used in some metals processing.
IFPRI estimates that global elemental sulphur exports fell 33% in the first half of 2026 compared with the same period of 2025, from 13.5 Mt to 9 Mt, with Gulf countries accounting for almost three-quarters of the reduction. The Strait was not the only factor: Kazakh exports were already falling and were further disrupted when Russia banned the transshipment of Kazakh sulphur on 24 May, a restriction lifted on 24 July. Kazakhstan also stopped sulphur exports on 27 June, while export controls were introduced in three producing countries. In its 18 September assessment, IFPRI reported that sulphur prices had more than doubled since the start of the year and had risen more than 40% since the Strait closed.
The effects have reached producers far from the Gulf. China’s elemental sulphur imports fell 58% in the first half, reducing its phosphate output and exports. Global phosphate exports, measured in phosphorus equivalents, fell by more than 9% in January–June, with large declines from China, Morocco and Russia. Mosaic began curtailing phosphate production in Louisiana earlier in the year and confirmed by late August that operations at both its Uncle Sam and Faustina facilities were idled, citing sulphur availability and cost. Saudi Arabia’s Ma’aden also cut its 2026 phosphate production guidance.
LNG: The link between energy and industrial production
Except for deliveries to Kuwait, almost all LNG exports from Qatar and the UAE pass through the Strait. In 2025, just over 112 billion cubic metres transited the waterway, almost 20% of global LNG trade. Qatar’s LNG facilities were severely damaged in Iranian attacks, complicating any recovery even if shipping resumes.
Natural gas is also the feedstock for ammonia and urea, so gas shortages feed through to fertiliser output. India illustrates the point: IFPRI reports that its nitrogen fertiliser imports rose by more than 1.1 Mt, or 52%, in the first half of 2026, mainly because the loss of Gulf LNG constrained domestic production and forced it to buy on global markets. India turned to China, Egypt, Viet Nam and Russia to make up the shortfall.
What benchmark prices show
Exhibit 2 tracks four World Bank benchmark prices against their February 2026 level, the last full month before the conflict began. Urea (prill, spot, f.o.b. Middle East) rose to roughly 82% above its February level in April, but by September it was about 14% below it. Japan’s LNG import-price benchmark peaked 38% higher in April and was still 26% above February in September. DAP rose steadily to 28% above February by September, while aluminium peaked about 20% higher in May and was 7% above its February level in September.
Exhibit 2. Benchmark price movements around the Hormuz escalation (February 2026 = 100)
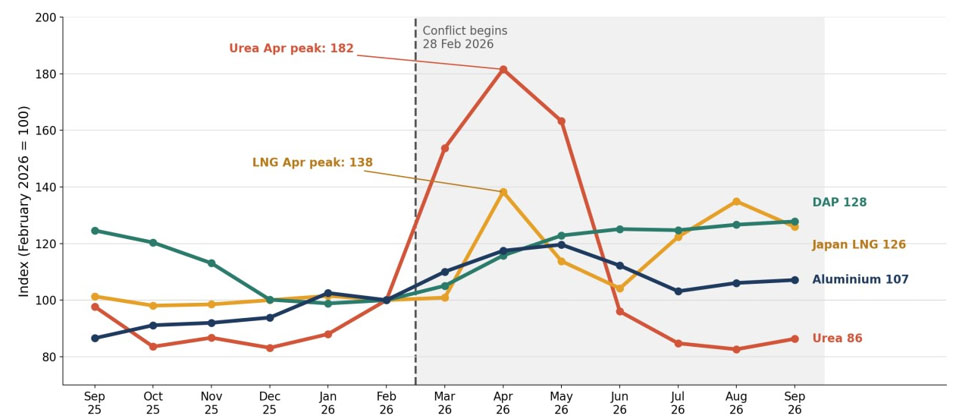
Source: World Bank Commodity Price Data (The Pink Sheet), monthly historical data updated 2 October 2026. Monthly average nominal US dollar prices, each indexed to its own February 2026 value. Series: Aluminium (LME, primary ingots, 99.7% purity); DAP (spot, f.o.b. US Gulf); urea (prill, spot, f.o.b. Middle East); LNG (Japan import price, cif). The latest two monthly observations for Japan LNG (August and September) are estimates and may be revised. The World Bank does not publish a sulphur series; sulphur price figures in the text are from IFPRI.
Note: Benchmark prices reflect many influences, including seasonal demand, Chinese export policy and, in the case of LNG, oil-linked contract pricing. The chart shows what happened to prices alongside the disruption; it does not isolate the effect of the Hormuz closure.
The wider lesson: Resilience depends on flexibility, and flexibility costs money
The urea and sulphur experiences point in opposite directions. Global nitrogen fertiliser exports, measured in nitrogen equivalents, fell by only about 9% in the first half, as China increased exports by about 47% and the United States by almost 60%, partly offsetting the decline in Gulf shipments. Urea prices have since retraced. Sulphur is different. IFPRI notes that options for substituting it are limited, and the Gulf’s share of traded sulphur had been close to half in every year from 2016 to 2025. Aluminium sits closer to the sulphur end of the spectrum: despite any offset from other producers, global primary output fell by 2.1% year on year in April.
The exposure is also not confined to direct imports. Shortages of intermediate inputs such as sulphur can disrupt production in countries that never buy the finished product from the Gulf. The costs of the disruption are being absorbed publicly as well: IFPRI notes that India’s fertiliser subsidy bill may exceed 3 trillion rupees this year, against 1.71 trillion budgeted.
For businesses and governments alike, the crisis highlights a weakness in supply-chain planning: exposure is often assessed through direct imports, while dependencies on intermediate inputs and concentrated production centres receive less attention. Diversifying suppliers, maintaining strategic inventories and securing alternative logistics can reduce this exposure, but each comes at a cost. The economics will differ by input. Where alternative suppliers are readily available, as with urea, markets can adjust relatively quickly. Where production is concentrated and substitution is difficult, as with sulphur, resilience requires more deliberate planning and a greater willingness to carry additional costs.
The implications extend beyond the commodities directly affected by the disruption. Manufacturers may face higher input costs or production constraints even when their own suppliers are outside the Gulf. For governments, the crisis highlights the importance of securing critical industrial inputs alongside energy supplies. The lasting lesson is that supply-chain resilience depends not only on where businesses source their finished materials, but also on the availability of the less visible inputs and trade routes that keep production moving.
Author:
Furkaan Khan (Senior Manager – Business Research) leads business research and market intelligence initiatives at AGR Knowledge Services, covering commodities, automotive, energy and industrial markets. His work centers on analysing macroeconomic trends, assessing sectoral performance and understanding how policy, trade and demand-supply dynamics shape key industries. This article reflects his interest in looking beyond headline developments to understand their wider implications for industries and businesses.